NM240010E
Ultrafast MAS
In solid-state NMR, interactions such as dipolar couplings and chemical shift anisotropy often result in extremely broad and low-sensitivity spectra in the stationary state. To address this issue, the sample is tilted at an angle of 54.74 degrees relative to the magnetic field and spun rapidly, creating a state similar to that of a solution. This technique, called MAS (Magic Angle Spinning), improves both resolution and sensitivity. For experiments observing 13C, a spinning speed of a few kHz is sufficient to average out heteronuclear dipolar interactions between 1H and 13C, and combined with 1H decoupling, spectra suitable for analysis can be obtained. However, homonuclear dipolar interactions, such as those between 1H nuclei, are stronger and require even higher spinning speeds for effective averaging. Recent advances in hardware have enabled spinning speeds exceeding 70 kHz, making 1H spectra useful for analysis in solid-state NMR. Figure 1 illustrates one-dimensional spectra of glycine acquired at spinning speeds ranging from 20 kHz to 110 kHz, demonstrating how high-speed spinning achieves higher resolution and sensitivity. This article presents an example of detailed structural analysis of histidine hydrochloride monohydrate using ultrafast MAS.

Figure 1. Structure of Glycine in the crystalline state and spinning speed dependence of its 1H spectrum
1H 1 D measurement
With high-resolution 1H spectra obtained through high-speed MAS, quantitative discussions become feasible. Fig. 2 shows the one-dimensional 1H spectrum of histidine hydrochloride monohydrate along with the integral values for each signal. Although some overlap between signals introduces errors, it is possible to correlate the integral values with the number of hydrogen atoms for the five signals, assigning 1, 1, 5, 2, and 3 hydrogens, respectively.

Figure 2. The one-dimensional 1H spectrum of histidine hydrochloride monohydrate, with the background reduced using DEPTH2.
1H-13C 2 D measurement
By acquiring a 1H-13C correlation spectrum, information about the proximity between 1H and 13C nuclei can be obtained. Figure 3 shows the 1H-13C HSQC spectrum. Here, the transfer of magnetization from 1H to 13C was achieved using the Cross Polarization (CP) method. To detect signals corresponding to direct CH bonds, the contact time for magnetization transfer was set to 0.2 ms. The spectrum reveals signals for two imidazole CH, aliphatic CH and CH2 groups, demonstrating that the aliphatic CH and CH2 signals overlapped in the one-dimensional 1H spectrum. Additionally, by increasing the contact time, it is possible to observe correlation signals over longer distances.

Figure 3. 1H-13C spectrum of histidine hydrochloride monohydrate
1H-14N 2 D measurement
By acquiring a 1H-14N correlation spectrum, information about the proximity between hydrogen and nitrogen atoms can be obtained. Figure 4 shows the 1H-14N T-HMQC spectrum. The interpretation of this spectrum is similar to that of the 1H-13C HSQC spectrum, but here, the transfer of magnetization from 1H to 14N was achieved using a different method called TRAPDOR. Three signals were detected: one corresponding to the NH3+ group and two signals corresponding to the NH groups in the imidazole ring.

Figure 4. 1H-14N spectrum of histidine hydrochloride monohydrate
1H-35Cl 2 D measurement
By acquiring a 1H-35Cl correlation spectrum, information about the proximity between hydrogen and chlorine atoms can be obtained. Figure 5 shows the 1H-35Cl DQ T-HMQC spectrum. The interpretation of this spectrum is similar to that of the 1H-13C HSQC and 1H-14N T-HMQC spectra, but a different measurement technique is used here. Since there is only one type of chlorine atom, only a single signal is observed along the vertical axis. However, this allows determination of which hydrogen atoms are in close proximity to the chlorine atom.

Figure 5. 1H-35Cl spectrum of histidine hydrochloride monohydrate
Assignment of signals
The projection spectra of the 1H one-dimensional spectrum and three projection spectra of two-dimensional experiments shown thus far are presented in Fig. 6. From the 1H-13C spectrum, the imidazole CH and CH, CH2 signals are assigned. Then, from the 1H-14N spectrum, the signals of two imidazole NH and NH3+ are assigned. Additionally, the signal that does not show correlation with either C or N is identified as the H2O signal. In this way, it is possible to assign signals by combining information from several two-dimensional spectra.

Figure 6. The projection spectra of the 1H one-dimensional spectrum and three two-dimensional correlation spectra of histidine hydrochloride monohydrate.
1H-1H Correlation spectrum (DQMAS)
Fig. 7 shows the 1H-1H correlation spectrum. Correlation signals are detected between two adjacent 1H atoms. In the DQMAS spectrum, the vertical axis represents the DQ (double quantum) shift, and correlation signals appear at positions symmetric to a line with a slope of 2. An example of the analysis is shown below. Focusing on the NH signal of the imidazole ring on the far left (red in the figure), five correlations are detected, indicated by red lines. These are correlation signals between the H atoms on the imidazole ring and water molecules. Similarly, focusing on the NH signal of the second imidazole ring from the left (yellow in the figure), correlation signals between the H atoms on the imidazole ring and water molecules are also detected. Although influenced by the molecular mobility, proximity information within approximately 2-3 Å can be obtained.
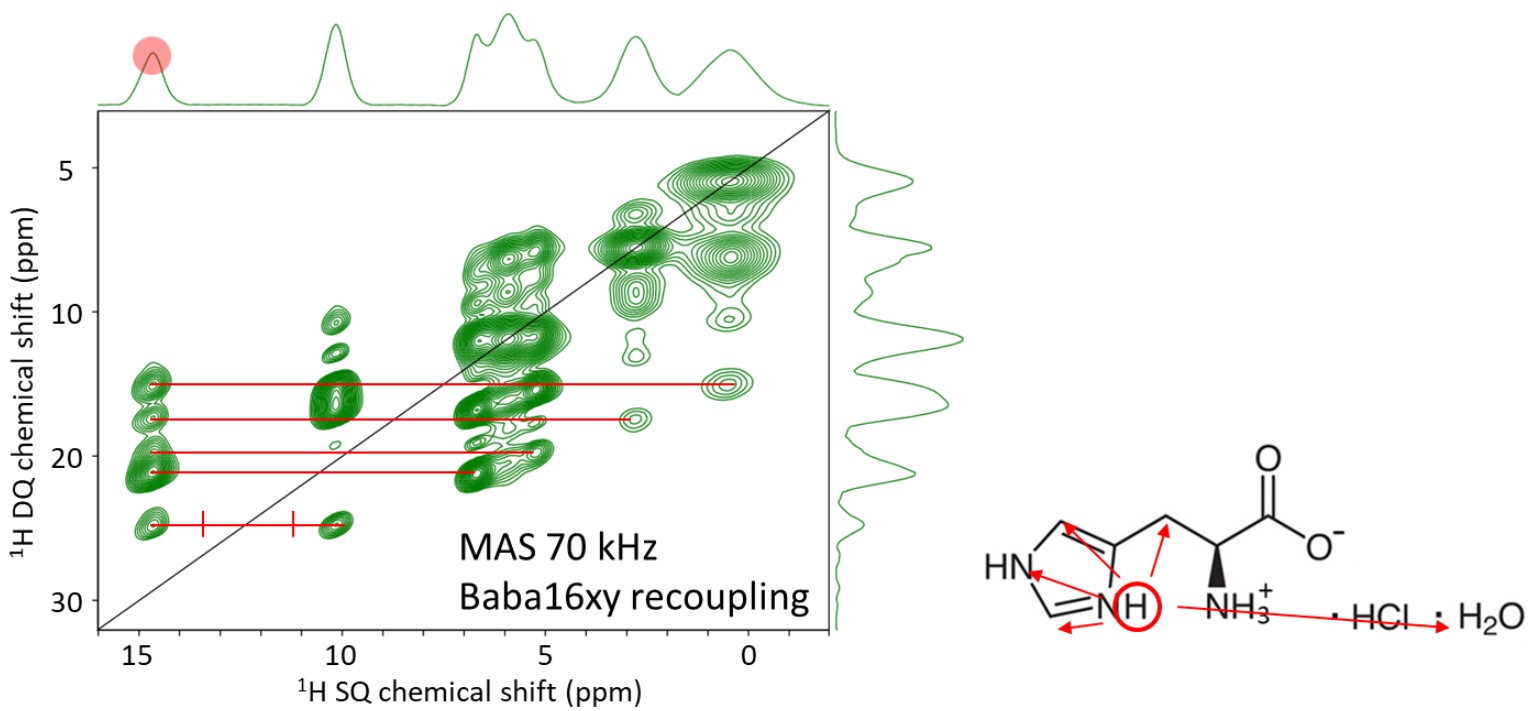

Figure 7. 1H DQMAS spectrum of Histidine hydrochloride monohydrate. A detailed analysis was performed on the two imidazole NH groups.
Reference
- Nishiyama, Y., Endo, Y., Nemoto, T., Utsumi, H., Yamauchi, K., Hioka, K., & Asakura, T. (2011). Journal of Magnetic Resonance, 208(1), 44–48.
- Jarvis, J. A., Haies, I. M., Williamson, P. T. F., & Carravetta, M. (2013). Phys. Chem. Chem. Phys., 20.
- Hung, I., & Gan, Z. (2020). J. Phys. Chem. Lett., 11(12).
- Saalwächter, K., Lange, F., Matyjaszewski, K., Huang, C.-F., & Graf, R. (2011). Journal of Magnetic Resonance, 212(1), 204–215.